Confidence Intervals
Introduction
Confidence intervals are often misunderstood and misinterpreted. This is, for example, pointed out in the article
R. D. Morey, R. Hoekstra, J. N. Rouda, M. D. Lee, and E. J. Wagenmakers, The fallacy of placing confidence in confidence intervals, Psychonomic Bulletin & Review, Volume 23, Pages 103–123 (2016)
which is accessible at
https://link.springer.com/article/10.3758/s13423-015-0947-8.
The fundamental question that we want to explore is: What is a confidence interval actually and how can it be interpreted, if at all?
Definition of a Confidence Interval
We may define a $100(1-\alpha)\%$ confidence interval is as follows:
Let $\theta\in \mathbb{R}$ be a parameter of a random variable $X$ and let $X_1,\ldots,X_n$ be a random sample of $X$.
A $100(1-\alpha)\%$ confidence interval procedure is a map $\varPhi$ that assigns to a set of measurements $x_1,\ldots,x_n$ an interval $\varPhi(x_1,\ldots,x_n)\subset \mathbb{R}$ such that for all possible values of $\theta$, the event $\varPhi(x_1,\ldots,x_n)\ni\theta$ has probability at least $1-\alpha$.
Given measurements $(x_1,\ldots,x_n)$ the interval $\varPhi(x_1,\ldots,x_n)$ is then said to be a $100(1-\alpha)\%$ confidence interval for $\theta$.
It is important to note that $\theta$ is not random, but a parameter value. The function $\varPhi$ is also not random. However, the input data $(x_1,\ldots,x_n)$ is of course the result of a random sample and therefore random.
By the weak law of large numbers, we can also characterize a confidence interval as follows: A confidence interval is the result of a procedure that, when applied to repeated random samples, includes the parameter $\theta$ at least $100(1-\alpha)\%$ of the time.
Confusion and Misunderstandings
We can summarize the above characterization of a confidence interval in the following statement:
- (S1) A $100(1-\alpha)\%$ confidence interval $[L_1,L_2]\subset\mathbb{R}$ is constructed in such a way that with probability $1-\alpha$ it will contain $\theta$.
Commonly, however, this statement is incorrectly interpreted as follows:
- (S2) Given a $100(1-\alpha)\%$ confidence interval $[L_1,L_2]\subset\mathbb{R}$, the probability that $\theta$ is contained in this interval is $1-\alpha$.
The statements (S1) and (S2) are not equivalent and, in fact, (S1) is correct while (S2) is false.
The difference between (S1) and (S2) can be explained as follows: $\theta$ is not random, but $L_1$ and $L_2$ are the result of a random sample. As stated in (S1), the confidence interval procedure is designed so that no matter what sample data $x_1,\ldots,x_n$ is obtained, the interval will include $\theta$ with probability $1-\alpha$.
However, once sample data has been obtained and $L_1$ and $L_2$ have been determined, there is no longer any randomness and either $\theta$ is in the confidence interval or it is not.
The statement (S2) is with regard to a different question: if $L_1$ and $L_2$ are given (i.e., sample data from $X$ has been obtained) and the parameter $\theta$ is unknown, one may ask: if any value of $\theta$ is possible in principle and we have no knowledge about which value $\theta$ might actually have in our population, we can consider that our population has been randomly selected from the universe of populations governed by all possible values of $\theta$. What is then the probability that $[L_1,L_2]$ includes $\theta$? (S2) purports that this probability is $1-\alpha$, but it should be clear that the confidence interval procedure is designed with a completely different purpose.
Exercises
The above is illustrated through the following model situations:
- The following example is from the book Information Theory, Inference, and Learning Algorithms by David MacKay (page 464), which is available at http://www.inference.org.uk/itila/book.html. Consider the discrete random variable $X\colon S\to(\theta,\theta+1)$, where $\theta\in\mathbb{Z}$, with density $f_\theta(\theta)=f_\theta(\theta+1)=1/2$. Hence, $X$ takes on either the value $\theta$ or the value $\theta+1$ with probability $1/2$ for either value. Let $X_1,X_2$ be a sample of size $n=2$ from the distribution of $X$ and define $X_{\min}:=\min\{X_1,X_2\}$ and $X_{\max}:=\max\{X_1,X_2\}$. By considering the four possible outcomes for $(X_1,X_2)$, show that $[X_{\min},X_{\max}]$ is a $75\%$ confidence interval for $\theta$.
- Suppose that, in the context of the above example, we measure $X_1=20$, $X_2=21$. The $75\%$ confidence interval is then $[X_{\min},X_{\max}]=[20,21]$. What is the probability that $\theta$ lies in this interval?
- Suppose that we measure $X_1=X_2=20$ so that the $75\%$ confidence interval is $[X_{\min},X_{\max}]=[20,20]$. No other information about $\theta$ is available, so we could have $\theta=20$ or $\theta=19$. Confirm, using Bayes’s Theorem, the intuitive statement that each value of $\theta$ is equally likely, i.e., the probability that $\theta$ lies in the $75\%$ confidence interval is $50\%$.
- A continuous version of this example, originally found here, is as follows: Let $Y$ follow a continuous uniform distribution on the interval $[-1/2,1/2]$ and define $X=\theta+Y$. let $X_1,X_2$ be a random sample of size $n=2$ from the distribution of $X$. Set $X_{\min}:=\min\{X_1,X_2\}$ and $X_{\max}:=\max\{X_1,X_2\}$. Show that $[X_{\min},X_{\max}]$ is a $50\%$ confidence interval for $\theta$. Suppose that a measurement yields values such that $x_{\max}-x_{\min}\ge 1/2$. Show that the probability that the interval $[x_{\min},x_{\max}]$ contains $\theta$ is $100\%$.
- A more complicated example with many facets is discussed in the article by Morey et al. mentioned at the top of this page. Study Example 1 and prove that both the Confidence Procedure 1 (sampling distribution of the mean) and the Confidence Procedure 2 (non-parametric) give $50\%$ confidence intervals. Explain and re-derive the graphics B and D in Figure 2. Explain what the horizontal dotted lines represent. Would you conclude that either of the two confidence procedures is “better” than the other?
An Alternative Phrasing
Since (S2) above is what most people would like to hear, while (S1) sounds confusingly similar, often (S1) is phrased as follows:
- (S1’) A $100(1-\alpha)\%$ confidence interval for a parameter $\theta$ is an interval $[L_1,L_2]\subset\mathbb{R}$ generated by a procedure that in repeated sampling has at least a $100(1-\alpha)\%$ probability of containing the true value of $\theta$, for all possible values of $\theta$.
This definition, following Neyman’s orginal version from 1937, is taken from the article by Morey et al. mentioned above. The idea that, in principle, probability statements are true if a sampling procedure can be repeated many times is at the heart of frequentist statistics. In practice, of course, most of the time only a single sample is taken. (This is one point of criticism leveled at frequentist statistics.)
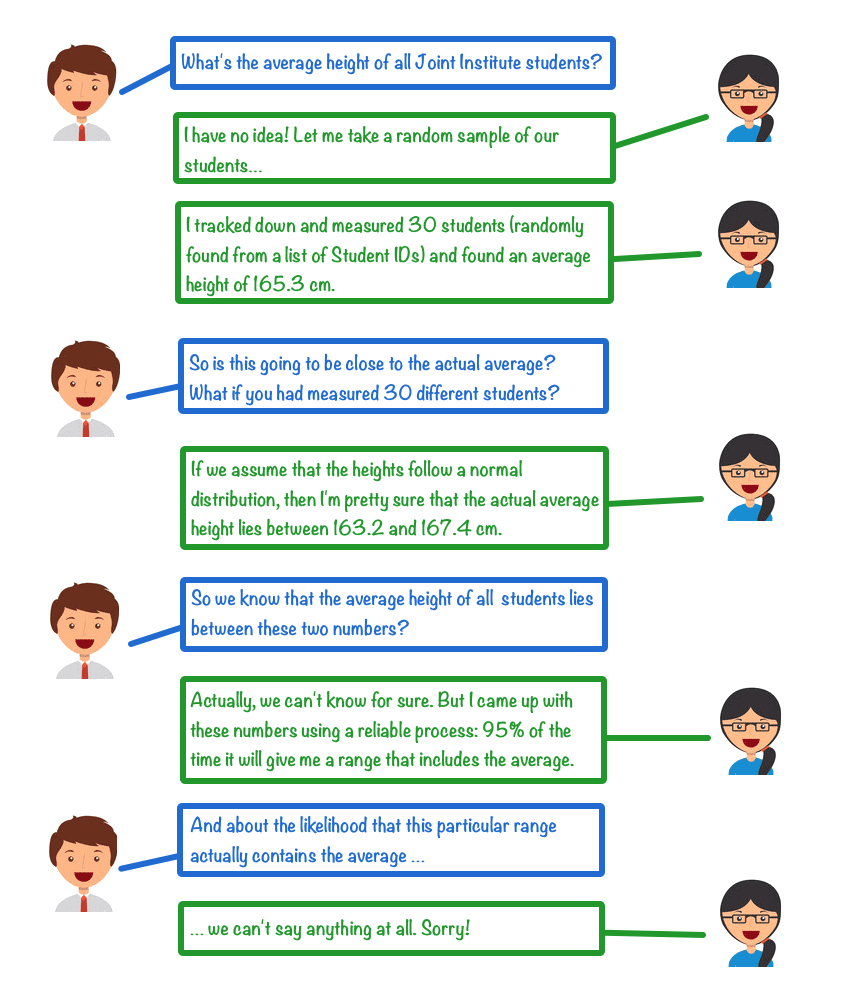
It is notable that Neyman does not ascribe any other properties to a given confidence interval, in particular whether it actually contains $\theta$. So how should one interpret a confidence interval with respect to the actual value of $\theta$? The pithy answer is “not at all,” as the dialogue below illustrates.