P-Hacking
I am indebted to Prof. Ailin Zhang for contributing this module. Her courses on Bayesian statistics, data science and machine learning are strongly recommended to anyone who wants to delve more deeply into these fields.
Introduction
For most studies, statistical significance is defined as a "P-value" less than 0.05 (p<0.05). This means that the difference observed between two groups would not be seen by chance even 1 in 20 times. That seems like a pretty high bar to prove that a difference is real.
But what if 20 comparisons are done and only the one that looks “significant” is presented? Or what if a trend is apparent in the data and samples are dropped or added to achieve this magic number of 0.05? And what if none of this is apparent in the publication and raw data are not available to allow for an unbiased analysis? Welcome to the world of p-hacking.
To understand P-Hacking, here are some useful resources:
- Aschwanden, C. Science isn't broken. FiveThrtyEight (2015). Online: https://fivethirtyeight.com/features/science-isnt-broken
- Nuzzo, R. Scientific method: Statistical errors. Nature (506), 150–152 (2014). https://doi.org/10.1038/506150a
A Practical Example
Now let’s start the exploration with a real example. Open the following page in your browser. Do not do anything yet! Just come back here and read the instructions:
https://projects.fivethirtyeight.com/p-hacking
In this project, you are invited to prove whether Republicans or Democrats are responsible for ruining the U.S. economy.
- You can decide on different independent variables (the inputs to your model): which kinds of political offices to include in your analysis.
- You can decide on analysis methods: ignore recessions, weight the results by the power of the office.
- You can decide on different dependent variables (the outputs of your model): different measures of the economy.
Question 1
State an explicit hypothesis of the form: "I think Democrats / Republicans will be good / bad for the economy."
State how you think it’s best to test this hypothesis... write down the independent and dependent variables and methods you want to use.
After you state your hypothesis, write a few sentences justifying the logic behind it.
Hypothesis: _______ will be _______ for the economy, and I will test this by including these factors: X, Y, Z.
Justification: The above Hypothesis is supported by observations A, B, C.
Now it’s time to explore the web widget. Use the website above to do the test you proposed above. What was the result? Record the p-value and describe the slope of the relationship (positive or negative).
Slope = ___ ; P-value = ___.
Question 2
Now it’s time to p-hack and try different things until you get the support for the party of your choice being good or bad for the economy. Try different combinations of the independent / dependent variables and the methods until you have picked a combination where p<0.05.
Keep track of the parameters you used in the table below and attach the screenshot from the website. Please make sure that your description of the parameters is sufficient for someone to reproduce your results! (You are expected to make up at least 3 combinations)
Remember, every change to the app (ticking / unticking a box) counts as a new “experiment"!
|
Attempt # |
Selected parameters |
Slope |
P-value |
|
1 |
|
|
|
|
2 |
|
|
|
|
3 |
|
|
|
Question 3
Now, do the same until you prove the exact opposite relationship. Did you propose that Democrats are good? Now prove that they are bad. Fiddle with all the settings until you can show it where p<0.05. Record the results as before, and provide a screenshot of the final result.
|
Attempt # |
Selected parameters |
Slope |
P-value |
|
1 |
|
|
|
|
2 |
|
|
|
|
3 |
|
|
|
Based your exploration and the article, think through the following questions and formulate your complete thoughts.
Question 4
Are all P-hackers purposefully cheating? Can you imagine doing this by accident? Defend your viewpoint with logic and/or evidence.
Question 5
Can people reasonably choose different methods and get different results on the same data? Defend your viewpoint with logic and/or evidence.
Question 6
In spite of all this trouble with reproducing research, the author of the article suggests that science isn’t in trouble. What do you think? Defend your viewpoint with logic and/or evidence.
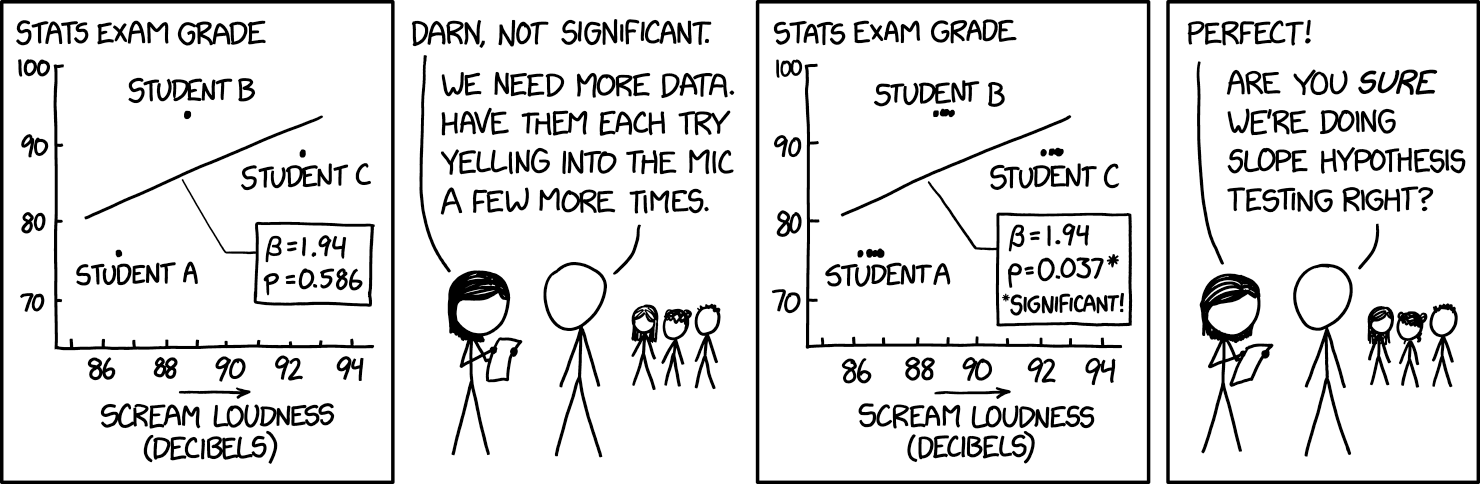
R. Munroe, Slope Hypothesis Testing, https://xkcd.com/2533/